Results: Trend Studies
For an understanding of changes of the composition of the atmosphere, it is important to gain long-term records of selected trace constituents at stations that are representative at least on a regional scale. For estimates of relevant trends, the availability of long time series is a prerequisite.
IMK-IFU addresses this issue by applying a variety of diffferent atmospheric sounding techniques at a variety of stations. We present two examples thereafter, i.e., combined in-situ and total-column measurements at the mountain site Zugspitze (2962 m a.s.l.) as well as in-situ measurements at the South African coastal station Cape Point (34°S, 18°E). For Zugspitze, records of surface ozone (O3) since 1978 and carbon monoxide (CO) since 1990 are available. FTIR-based total column measurements at Zugspitze cover more than a decade.
At the southern hemispheric coastal station Cape Point, located on top of a cliff at the southern tip of the Cape Peninsula, IMK-IFU is a partner of the South African Weather Service (SAWS). The focus is on trends and seasonal cycles of CO2, CH4, O3 and CO in air representing background conditions.
In order to detect important changes in the records obtained by these different measurements, data have to be processed with statistical tools and data filtering by way of different parameters.
Carbon monoxide in the atmosphere originates to a major extent from anthropogenic activities. Emission reductions during recent years were assumed to yield a decrease in the tropospheric mixing ratios. However, these may have been counterbalanced due to emissions by biomass burning, as has been considered in the literature. In-situ and total column CO at Zugspitze have revealed important temporal changes in their characteristics (Figs. 1 + 2).
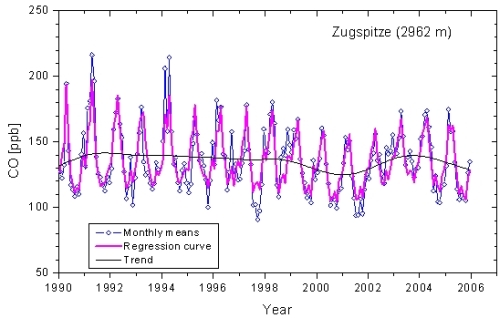
Figure 1: in-situ CO monthly means (1990 - 2005) at Zugspitze together with trend curve.
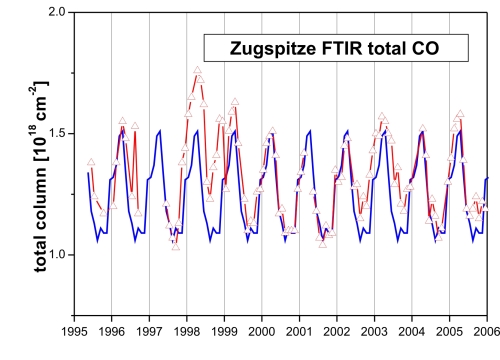
Figure 2: Monthly mean total column amounts of CO (in molecules cm-2) above Zugspitze. The solid blue line corresponds to the monthly means averaged over the period from March 2000 to Februrary 2002.
The following figure gives an overview on the long-term development of surface ozone at Zugspitze. As indicated by the trend curve, the growth during the recent years was closely around zero. However, the year 2003, with its hot summer, brought about increased O3 levels, and 2004 showed some decrease due to rather cloudy conditions.
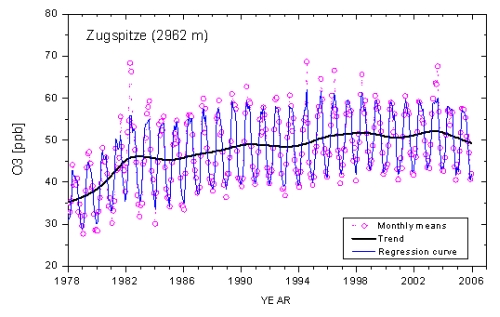
Figure 3: Monthly means of surface ozone at Zugspitze (1978 - 2005) and trend curve.
The CO record at Cape Point (starting in 1979) is the longest in the southern hemisphere (SH). It displays an average CO mixing ratio around 50 ppb, which is about half of the background value in the northern hemisphere, but no significant long-term trend. The annual minimum around February/March and the maximum around September/October are well reproduced in time. There is, however, pronounced interannual variability of the amplitudes.
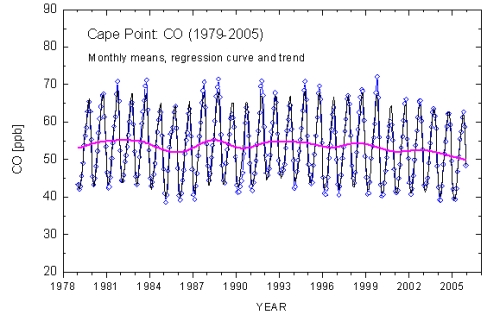
Figure 4: Monthly means of CO (1979 - 2005) at Cape Point (South Africa) with flat trend curve.
The CO2 record shows an overall increase with interannual variations of the growth rates. In the last part of the record, rates are systematically higher than before and have stabilised at about 2 ppm yr -1. This could possibly be in response to increased CO2 emissions in Asia. In order to detect minor longitudinal differences in CO2 concentrations, which are of interest for SH CO2 budgets, measurements at different sites are requested to achieve a network comparability of 0.05 ppm.
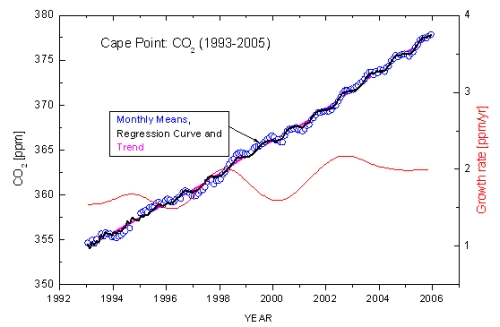
Figure 5: Monthly means of CO2 (1993 - 2005) at Cape Point together with growth rate curve.
The trend of methane at Cape Point has flattened since the 1990s, and growth rates are close to zero now (Fig. 6). Observations at a single site contribute to the hemispheric picture, but do not contain enough information to explain temporal developments. In the case of CH4, the understanding of the budget is still insufficient on the global scale and does not permit predictions of the future trend.
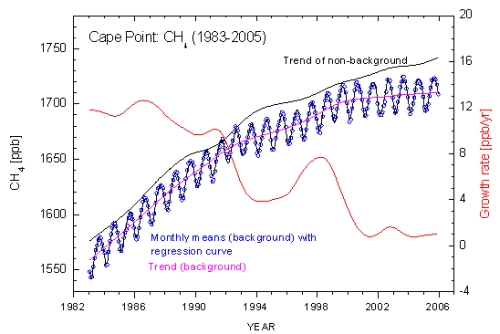
Figure 6: Monthly means of CH4 (1983 - 2005) at Cape Point together with growth rate curve.
References